|
03/18/2022 07:44AM |
|
03/18/2022 04:02PM |
|
07/08/2022 01:23PM |

A fairly significant swath of abnormal dryness is extending into southern MN. The farmers need some rain down there! Also a tiny patch of moderate drought in the far eastern metro along the St. Croix. First chance of rain in the area is Monday but I'll defer to Whitewolf on the forecasting. That's his bailiwick.
|
03/18/2022 01:29PM |
|
10/27/2023 08:18AM |
|
03/21/2022 05:24AM |
URGENT - WINTER WEATHER MESSAGE
National Weather Service Duluth MN
331 AM CDT Mon Mar 21 2022
MNZ021-212045-
/O.NEW.KDLH.WS.W.0006.220322T0600Z-220323T1800Z/
Southern Cook-
Including the city of Grand Marais
331 AM CDT Mon Mar 21 2022
...WINTER STORM WARNING IN EFFECT FROM 1 AM TUESDAY TO 1 PM CDT
WEDNESDAY...
* WHAT...Heavy snow expected. Total snow accumulations of 7 to 11
inches with locally higher amounts to 15 inches possible. Winds
gusting as high as 35 mph.
* WHERE...Southern Cook County. This includes the Tribal Lands
of the Grand Portage Reservation.
* WHEN...From 1 AM Tuesday to 1 PM CDT Wednesday.
* IMPACTS...Travel could be very difficult. The hazardous
conditions could impact the morning and evening commutes.
* ADDITIONAL DETAILS...Snow should be heavy and wet in nature and
may cause power outages and down trees. Ice accumulations of
around one tenth of an inch are possible near the Tofte area.
PRECAUTIONARY/PREPAREDNESS ACTIONS...
If you must travel, keep an extra flashlight, food, and water in
your vehicle in case of an emergency.
The latest road conditions can be obtained by calling 5 1 1.
Road conditions can also be found at 511mn.org for Minnesota or
511wi.gov for Wisconsin.
&&
$$
|
03/21/2022 05:29AM |
I see more (below normal temps / snow) in the future before this pattern breaks. ( mid April) Other areas further S (MSP etc) may still see accumulating snow and below normal temps (after this recent rise) -- but isn't that to be expected? In the last 10-20 years- the Springs have been much colder to avg compared to Falls ( OCT-DEC) in this neck of the woods. -- Winters have seem to be started slower, but hung on more. This season may be another case of that.
|
03/21/2022 01:30PM |
Pinetree: "I do see with only 50 years' data that this winter was by far the windiest winter on record for Minnesota."
Don't believe it. Anemometers are the Devil's Merry-Go-Round. Also, don't believe thermometers. Thermometers are the Devil's Soda Straws, which SHOULD HAVE BEEN RECALLED for having two sealed ends. Hell really needs some regulations.
|
12/15/2021 05:25PM |
|
11/05/2022 07:53AM |
|
11/05/2022 09:34AM |
|
11/19/2021 10:03AM |
HighnDry: "I wonder if this will be the last drought monitor of the season? It's dated Nov. 16th.
"
FYI, drought monitoring and the US drought monitor maps happen all year. They are produced every Tuesday and go out to the public every Thursday. Once things get locked up by the freeze they do not change much during the winter in Minnesota.
|
11/19/2021 07:36AM |
Most if not all of the "red" or extreme drought category are now gone except for -- the arrowhead (boundary waters) area in the state.
I'm hoping for a lot of snow up north this winter.
|
02/25/2023 06:31AM |
In separate reports, there's apparently 2 to 4 inches of water locked into the snowpack statewide (averaging over all regions) which makes for above normal flooding probabilities---particularly in the upper Mississippi river basin. So, we'll see come Spring.....

|
03/24/2023 08:23AM |
Here's an updated flood outlook for MN: NWS Updated Flood Forecast for MN Rivers
|
09/19/2022 07:46PM |
MHS67: "Jeriatric: "Heat this week (106-113F) and dryness have caught us here in Northern CA. Fire started about 6:30 pm Tuesday. Now, it's thousands of acres and the Gov. declared an emergency yesterday. This morning, firefighters are concentrated in my town (Foresthill) trying to prevent the burning of structures. I am under mandatory evacuation in Auburn."
Hey Jerry was wondering how you guys were doing. Hope they keep the fire south of you. I haven't seen the ops report for today yet, we will keep our fingers crossed!! Larry"
Hi Larry. We got home Sunday afternoon just after we were allowed to repopulate our area. Most of the neighbors were arriving and we had some discussions on what we had all done for the last 2 weeks. Our first chore was to empty the frig and freezers of spoiled food and take it to some bins that had been placed at a church for receiving such waste.
We have no propane yet and we are supposed to wait for our supplier to turn it on Tues. We have had electricity since we got home.
My wife keeps the windows open and is airing out the house with the whole-house fan. Roberta's nose is better than mine so I am not bothered as much as her.
The last 2 days we have received 0.75 to 2.00 inches of rain over the fire area. The fire is suppressed now but we have been warned that it is expected to flare up again when the rain is finished.
|
09/20/2022 05:39PM |
Jeriatric: "MHS67: "Jeriatric: "Heat this week (106-113F) and dryness have caught us here in Northern CA. Fire started about 6:30 pm Tuesday. Now, it's thousands of acres and the Gov. declared an emergency yesterday. This morning, firefighters are concentrated in my town (Foresthill) trying to prevent the burning of structures. I am under mandatory evacuation in Auburn."
Hey Jerry was wondering how you guys were doing. Hope they keep the fire south of you. I haven't seen the ops report for today yet, we will keep our fingers crossed!! Larry"
Hi Larry. We got home Sunday afternoon just after we were allowed to repopulate our area. Most of the neighbors were arriving and we had some discussions on what we had all done for the last 2 weeks. Our first chore was to empty the frig and freezers of spoiled food and take it to some bins that had been placed at a church for receiving such waste.
We have no propane yet and we are supposed to wait for our supplier to turn it on Tues. We have had electricity since we got home.
My wife keeps the windows open and is airing out the house with the whole-house fan. Roberta's nose is better than mine so I am not bothered as much as her.
The last 2 days we have received 0.75 to 2.00 inches of rain over the fire area. The fire is suppressed now but we have been warned that it is expected to flare up again when the rain is finished. "
Glad you made it back home. They are right, as soon as this dry spell hits the fire will flare up. It looks like the west side of the fire is pretty secure. The east side will give them problems for awhile though. Sue said to tell Roberta hi! Stay safe!!
|
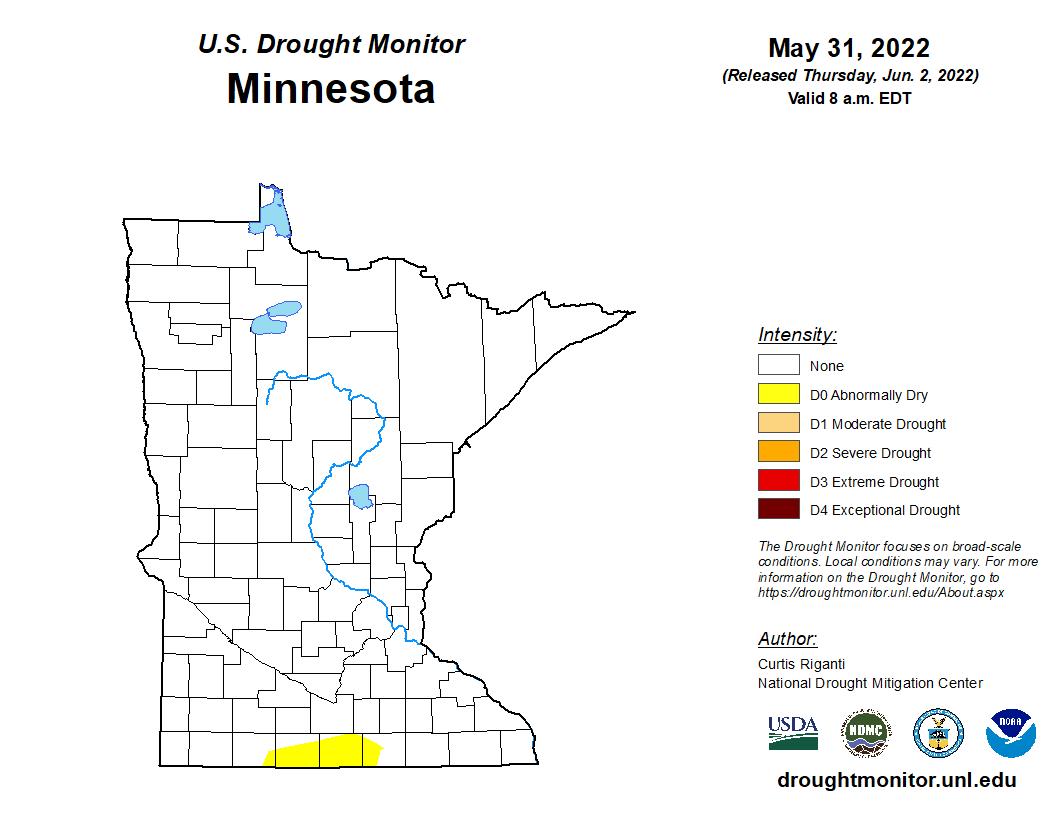
06/01/2023 09:31AM |

What a difference a week makes...
|
09/09/2022 10:57AM |
|
02/26/2022 02:01PM |
HighnDry: " This is the latest drought monitor map. There's been a small decrease across the board in drought categories since the previous week. It's not much but it's something."
Dang, it's so hard to believe that the arrowhead region is still moderate to severe considering all the snow I've heard has fallen up there.
|
03/07/2022 12:29PM |
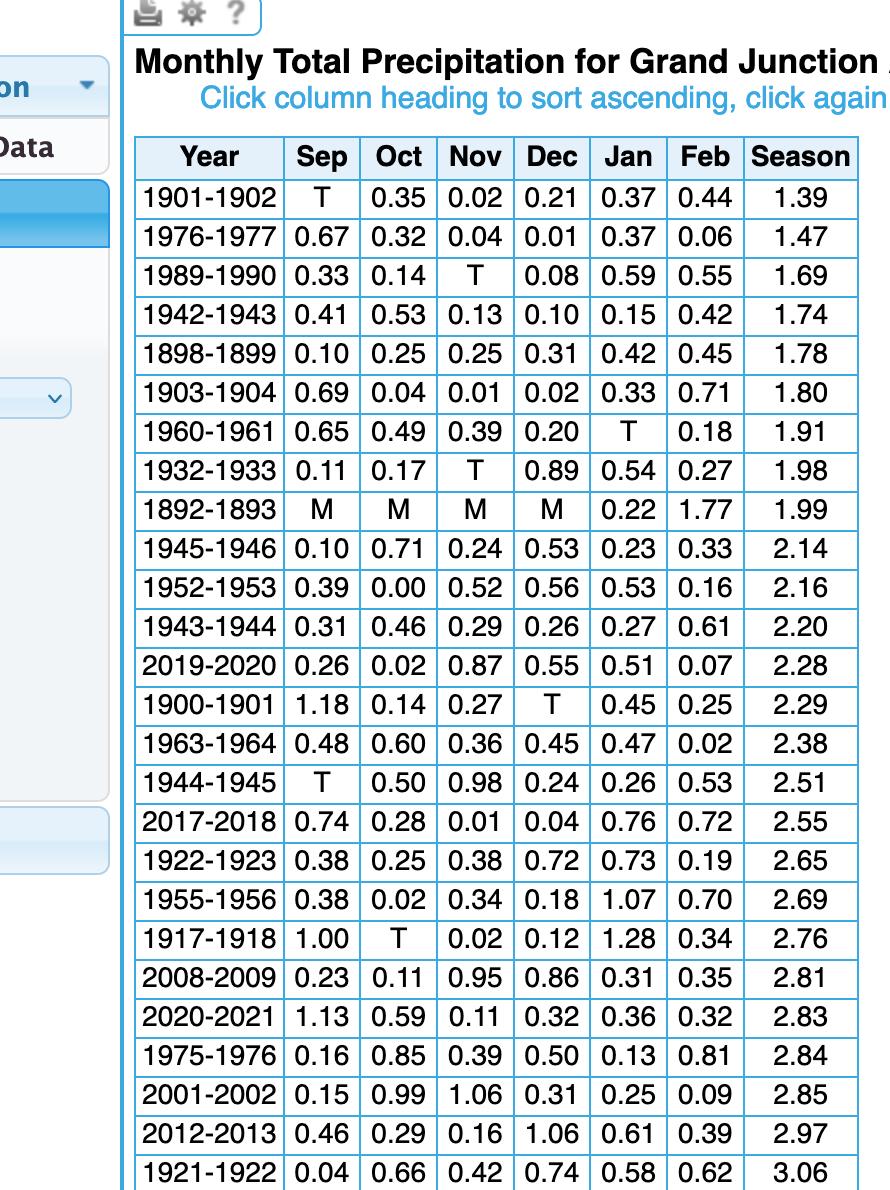
w_w_w_31: "I am in the West, Grand Junction CO to be exact. It is creepy dry out here. It is the worst drought in 1200 years. Phoenix lost a significant amount of their water from the Colorado River on January 1 this year, and it is looking like they are going to be losing more. Yet, people are moving to the SW in droves. I do not think that is a smart move, at all. Climate change is real, like it or not. We all have to accept it and work within a new reality. Just like covid, we are not going back to "how it was" anytime soon, if at all ever.The population growth in the southwest to me is unsustainable with so little water, underground or surface. In biological terms were an over capacity for the habitat.
dave
"
|
03/07/2022 12:24PM |
w_w_w_31: "I am in the West, Grand Junction CO to be exact. It is creepy dry out here. It is the worst drought in 1200 years. Phoenix lost a significant amount of their water from the Colorado River on January 1 this year, and it is looking like they are going to be losing more. Yet, people are moving to the SW in droves. I do not think that is a smart move, at all. Climate change is real, like it or not. We all have to accept it and work within a new reality. Just like covid, we are not going back to "how it was" anytime soon, if at all ever.
dave
"
Don't know if you mean exactly the Grand Junction area- but Grand Junction area has seen a very wet winter. Wettest DEC on record and top 15 wettest SEP-FEB on record. Maybe you meant a differnt area?? Even so- the West Mtns are no where near "1200" year drought levels. Where they get that from - other than true observational data- is beyond me. True climate observed (records) only go back 120 years or so in the area you describe. 1200 years is a DEEP stretch. Just my .02 as a professional in the weather/climate field for 25 years.


|
03/07/2022 03:05PM |
|
04/07/2023 06:44AM |
HighnDry: " MN Northeast Flood Gages Map "
This should be interesting to watch over the next 7-10 days.
|
05/19/2022 10:26PM |
Here's the map:

|
05/20/2022 08:13AM |
I just wanted to say thank you for all your follow up work on posting the drought levels. I really appreciate it.
|
03/30/2024 08:31PM |
|
10/26/2023 01:12PM |
HighnDry: "The red has almost disappeared from the MN map which is an improvement, believe it or not. It's at least a bit less than compared to 3 months ago, although we could certainly use more rain....
"
We got 3.6" south of Rochester on Tuesday with light drizzle all night Wednesday and forecasted rain tonight and tomorrow.
|
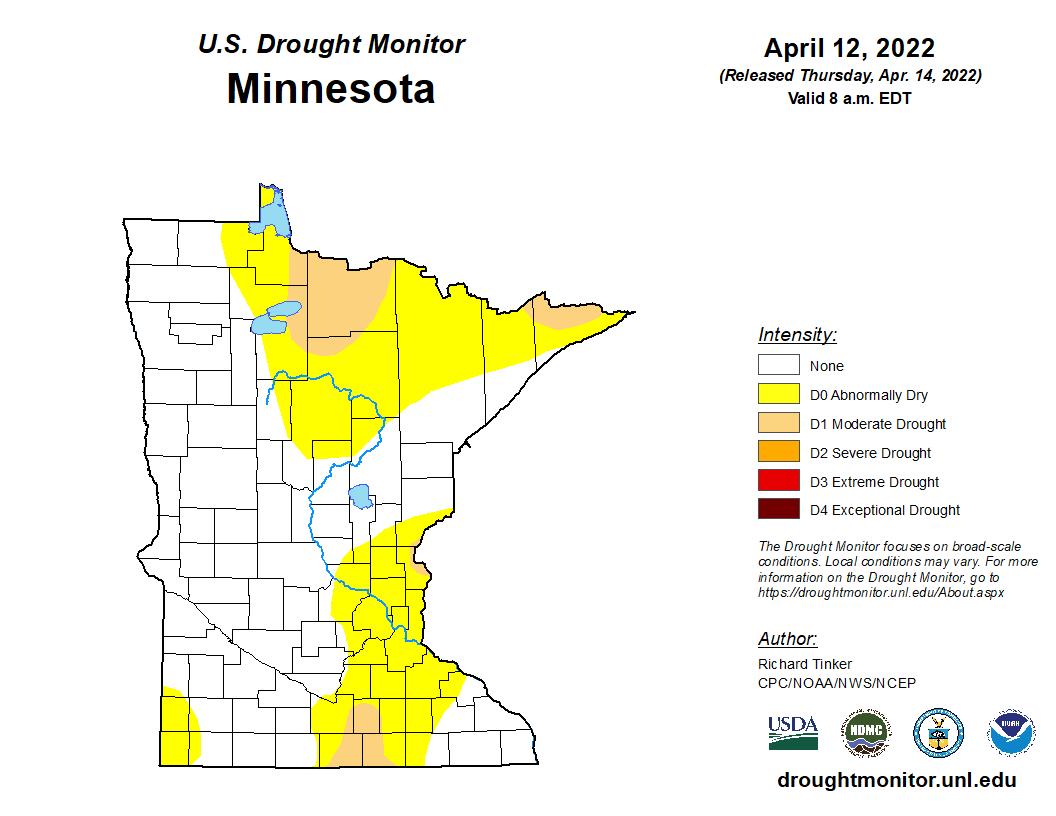
04/14/2022 06:59PM |
Late wet spring weather is helping this trend.
|
12/09/2021 08:32PM |
Drought Map
|
03/10/2022 07:51AM |
Here's the map.

Link is here.
|
10/26/2023 08:53AM |
|
06/09/2023 08:21AM |
|
12/13/2021 09:43PM |
HighnDry: "This one is looking better but there is still red in the BWCA (although it's gradually shrinking). The snow up there has to help.
Drought Map "
Thanks for putting this up. I'm amazed that the absolute worst section is the BW itself and nowhere else. I wonder how that is possible.
|
12/14/2021 09:37AM |
OneMatch: "HighnDry: "This one is looking better but there is still red in the BWCA (although it's gradually shrinking). The snow up there has to help.
Drought Map "
Thanks for putting this up. I'm amazed that the absolute worst section is the BW itself and nowhere else. I wonder how that is possible.
"
Canada/Ontario has the area north of the border and the Q listed as D3 Extreme Drought as of November.
Canada Drought Monitor
|
12/17/2021 07:27AM |
|
03/19/2022 08:15AM |
Good morning Whitewolf,
I'm not attacking you, let me make that clear. You had asked where they had gotten the 1200 year drought idea from. I found it. From a study that "was a collaboration among researchers from UCLA, NASA, and the Columbia Climate School."
I do have one question though for you. You say that the study I found was "based on non-human induced data." Can you define that term and it's limits and advantages a bit more? From your reply, and correct me if I am wrong, but it looks like you are tossing out any data that wasn't collected by a human living at the time of the observed data.
That seems like a pretty big deal what you say about the bad automation precip tracking since the 1990's and how automatic observations from the last 40 (100?) years is unreliable. Can you say more, because it sounds like a low-grade conspiracy theory right now.
You also say "Be careful with the data you present." I also say that to you. In fact, because of your years of experience and being a person of learned authority in the weather, I would say that line really applies to you more then me because of how people look to you for answers.
|
03/19/2022 04:30AM |
" According to a bucket-type water-balance model forced by monthly climate data,"-- ( I could add on to this 1000 times for automated data at airport sites-- which are according to NOAA--CLIMATE SITES)
this data is not accurate - it comes from an automated system-- which misses At least 10% of falling precip ASOS/AWOS compared to a manual 8" gauge that a human would measure.-- more in heavy precip and more in the winter AND sometimes ALL precip without a human to back it up. With Automation in measuring "climate" -- especially precip- we have left the lines of what is "normal" compared to what it was before automation. You be the judge knowing this.
This is my job and has been for 25 years. Not taking away from your main point - yes temps are rising for some-- but precip totals at long range (100-150 years) climate sites are becoming CRAP. So any invest in them in the last 40 years (compared to the past) is not true science. I hate to say this- but it's truth. NWS knows this- but they sold a crappy system (ASOS / AWOS) to the FAA in the mid 1990's and now is mum on their mistake and will not take sides. Imagine that.
And if the world's climate is warming up- that means the mixing ratio of water vapor to saturation (ratio) is increasing and should force more precip on the Earth-- simple physics. Sure some areas will see more than others- just like temps. Being dogmatic on this worldwide is foolish - and any MET will tell you this.
Be careful with data you present. If it's automated- it's almost certain to have holes in it. So will human data- but not to the extent of this FULLY automation catastrophe that has ruined 100's of years of human observational weather records being that it's not the same "science" being recorded. Basically if your going to talk climate- (last 150 years is all I care about) make sure you know what your talking about with myself and others. Sure your post has all the data and all, but much of it- not to you personally- is hogwash when you actually work with it- which I do. Most here will dismiss me - but I got 25 years in the field as a professional. Just saying- but some will still say I'am crazy because ?? Some people put faith in people that know nothing.
Enjoy the weather- it's the only weather you got.
|
03/19/2022 04:59PM |
|
03/19/2022 04:10PM |
Minnesotian: "
Good morning Whitewolf,
I'm not attacking you, let me make that clear. You had asked where they had gotten the 1200 year drought idea from. I found it. From a study that "was a collaboration among researchers from UCLA, NASA, and the Columbia Climate School."
I do have one question though for you. You say that the study I found was "based on non-human induced data." Can you define that term and it's limits and advantages a bit more? From your reply, and correct me if I am wrong, but it looks like you are tossing out any data that wasn't collected by a human living at the time of the observed data.
That seems like a pretty big deal what you say about the bad automation precip tracking since the 1990's and how automatic observations from the last 40 (100?) years is unreliable. Can you say more, because it sounds like a low-grade conspiracy theory right now.
You also say "Be careful with the data you present." I also say that to you. In fact, because of your years of experience and being a person of learned authority in the weather, I would say that line really applies to you more then me because of how people look to you for answers. "
#1- Official climate data for most locations in the USA only goes back 100 to 150 years. Don't toss anything before that - but it's not official and should be treated that way. Droughts a 1000 years ago? Sure, but lets stick with what is actually recorded -- apples to apples so to say. Even then- and here is the automation deal- it's been tainted since automation removed human observers at about 80% of long term climate sites. Climate is not "observed" the same way it was before automation took over. That might be a shock to some, but it's the simple truth. Many examples I could give- one is snowfall. automation can't measure snowfall so at many climate sites- it has gone missing unless , in my point below, the NWS gets a COOP observer ( or other methods) to measure it , but in most instances not anywhere near the airport where it was measured before automation. Thus- its not observed at the same location and vastly skewed as you know snowfall/rainfall can vary greatly over small distances.
#2- as mentioned - ASOS/AWOS ( weather automation at your local airport)- tipping buckets that measure precip - will almost ALWAYS under report precip - especially in heavy rain and dry snow events. This is because of the design - I won't get into it, but a simple google search "tipping bucket (automated rain gauge) compared to manual (8" rain gauge) accuracy " should help. Most airports (official climate sites for much of the USA) are thus skewed compared to when humans did it at the airports. At a small % of sites across the USA- the NWS has realized this and has COOP observers that manually report precip (for free of charge).
#3- Good point. I try to present data (as it's given--see above) the best I know how to. But I also try to educate people in the "flys in the ointment" in the actual recording of the data. It's actually gotten so bad at some sites that even with data presented to the NWS from humans that manually recorded the data ( say precip) - the NWS will use the automation even when it's Missing due to automation error OVER the human data. Why? Because automation of weather data is here to stay and manual data is not.
Enjoy the weather- it's the only weather you got.
|
02/04/2022 12:13PM |
So winter time drought monitor maps are.....sub-par at best. I'll just wait till spring starts to arrive and see how it's going then
|
03/31/2022 07:46AM |

Here is the link if you want to see the breakdown in drought by category.
Things are improving.
|
04/21/2022 08:27AM |
|
04/28/2022 07:38AM |

As can be seen from the map, the "light brown" moderate brown category has disappeared completely except for (0.10%) a sliver in the southernmost central part of the map. Abnormally dry (yellow) has shrunk statewide from 34.22% to 12.22%.
Rain is forecast this weekend starting today in the south of the state and spreading northward. I leave it to WW to give you the details :). Good news overall for farmers and canoeists alike.
P.s. I heard my first peepers this week. Surely I sign that spring is hear. And don't call me shirley.
|
12/28/2023 10:08AM |

Link to US Drought Monitor
|
05/20/2022 08:52AM |
|
05/26/2023 07:31AM |
Current MN drought map

|
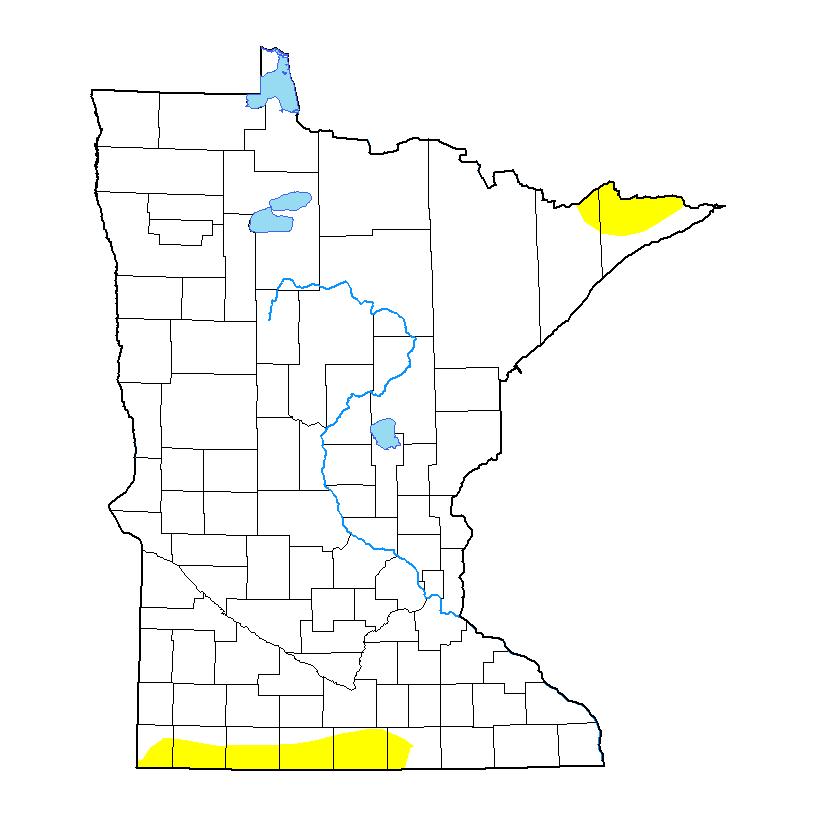
05/05/2022 08:21AM |

Drought conditions continue to improve with the state reporting 93.55% of the state drought-free. The yellow "abnormal dryness" area in the state was cut in half from roughly 12.2% to 6.45%.
There is still a stubborn patch of abnormal dryness sticking around in the BWCA. A little more moisture is needed there to fill up the lakes and increase soil moisture.
|
06/02/2022 08:47AM |
|
07/08/2022 01:55PM |
HighnDry: "I haven't pulled one of these off the drought monitor website for a couple of weeks, so here goes:
A fairly significant swath of abnormal dryness is extending into southern MN. The farmers need some rain down there! Also a tiny patch of moderate drought in the far eastern metro along the St. Croix. First chance of rain in the area is Monday but I'll defer to Whitewolf on the forecasting. That's his bailiwick."
No draught in north central Minnesota-just one of the best mosquito's year classes in decades.
|
07/08/2022 06:22PM |
Billion Dollar rain in the driest parts of MN.
|
04/13/2012 12:24PM |
quote tumblehome: "Rain forecast for tonight and snow on Monday. It is dry but not nearly as dry as it could be or has been in years past. Northern MN has been getting rain every few days.
-T"
But not much rain. Checked the ground. In spite of the rain, the earth is dry.
|
04/13/2012 03:31PM |
quote Chilly: " fast forward to 4 min and 20 sec "
Get off the water and out of the canoe before 5 minutes 9 seconds :)
|
04/13/2012 11:29AM |
|
04/13/2012 07:35AM |
Mocha, can you do a rain dance up there?

|
04/13/2012 08:13PM |
|
04/13/2012 12:40PM |
|
04/13/2012 11:57AM |
-T
|
04/13/2012 09:26PM |
|
04/14/2012 11:44AM |
i'd like to see a map that shows rain amounts in various areas of northern MN... it can be raining at my house and sunny 5 miles from here.
|
04/14/2012 12:17PM |
 We are sending our extra rain your way, as you see the white area is not suffering....since Oct. 1 we have had 58.69 inches of rain....since Jan. 1 39.50 inches
fishguts
|
03/31/2024 10:32AM |
|
06/08/2023 09:08AM |

|
06/08/2023 08:14AM |

|
06/08/2023 08:39AM |
|
03/07/2023 02:20PM |
|
08/12/2022 06:45AM |
link to map
|
07/28/2022 10:23AM |
US drought monitor
|
07/28/2022 10:42AM |
LindenTree: "It is back, abnormally dry in the Duluth and Superior WI area. Ashland WI is in moderate drought. Wonder how far north this trend will continue this summer and fall.
US drought monitor "
You wonder, as of now North Central Minnesota we are doing quite well and quite moist this year. Hay crops are a record level high. I do see the rains have been widely scattered to who is getting it.
|
08/07/2022 09:47AM |
|
08/18/2022 08:41AM |

A little better. The map obviously doesn't include yesterday's rains.
Link to map.
|
09/01/2022 06:47PM |

Link to Map
|
04/10/2024 08:35PM |
Pretty dry up there.
|
04/18/2024 09:59AM |
drought 04-18

The latest drought monitor: this does not include rainfall after 7 a.m. Tuesday
National Drought Mitigation Center
Thursday’s U.S. Drought Monitor report is unchanged due to the heaviest rain falling in central Minnesota, over areas already removed from drought and abnormally dry categories. Also, the data cutoff for each Thursday’s update is 7 a.m. Tuesday, so the new report does not include Tuesday and Wednesday’s rainfall.
--I lifted this from MPR, because it was easier that typing it in manually. The bottom line is that drought may be easing if we can continually see more rain or precipitation in general.
|
09/15/2022 11:14PM |
Jeriatric: "Heat this week (106-113F) and dryness have caught us here in Northern CA. Fire started about 6:30 pm Tuesday. Now, it's thousands of acres and the Gov. declared an emergency yesterday. This morning, firefighters are concentrated in my town (Foresthill) trying to prevent the burning of structures. I am under mandatory evacuation in Auburn."
Hey Jerry was wondering how you guys were doing. Hope they keep the fire south of you. I haven't seen the ops report for today yet, we will keep our fingers crossed!! Larry
|
10/01/2022 03:50PM |
National Drought Monitor.
|
10/07/2022 09:58AM |
Quotes
"Parts of Minnesota are now under extreme drought conditions, after the driest September on record in the Twin Cities and sparse amounts of rain over the last week. The area of severe drought also worsened across Minnesota and Wisconsin over the last week. The Twin Cities didn't even get a quarter of an inch of rain in September; there were a few sprinkles, but rain totals were low compared to the average 3 inches of rain that usually falls during the month."
"As we head into what is climatologically the driest part of the year, it'll be harder to make up the deficit because of a historical lack of moisture, caused by dry winter air."
Drought in MN
|
11/04/2022 03:05PM |

|
12/16/2022 06:47AM |

|
12/16/2022 08:25AM |
HighnDry: "As LT noted above, this is looking fairly locked in. It's doubtful that the piles of snow state-wide will impact this outlook greatly going forward. It's time to start those winter-time hobbies as we count down to 'Copia in March :)
MN actually gained some drought last week on 12/8. The area directly south of Ottertail Cty in Pope cty and Bigstone area increased to severe drought.
|
02/26/2022 04:06PM |
We were on the North Shore 2/14-19 but not very far inland from the big lake. Skiing a few miles up Sawbill Trail, the snow was thigh deep in undrifted spot, 3+ feet. The same distance inland from Grand Marais on the Gunflint seemed to be more like 2 feet deep. Highly unscientific. More snow was falling during the week. Let's hope for steadily improving drought conditions as spring comes.
|
10/28/2021 06:37AM |
Here's the latest map .
Compare this one to the map posted above by OneMatch in 2012. What a difference!
|
11/04/2022 03:22PM |
|
03/22/2022 07:03AM |
see lower left graphic. That's a ton for this time of year based on climo avg's. About a April or May avg precip in one storm. or just about what fell all of last winter (esp E) in one storm. Simply good news for water levels and busting the drought.

|
04/07/2022 07:44AM |

The link is here.
There is also a page for comparing the previous week to the current one. It makes discerning the week-to-week drought conditions easier to visualize. It's here. You will have to manipulate this page to select the "state" and "Minnesota" to get the two maps to display.
|
03/17/2022 08:40PM |

|
03/03/2022 08:47AM |

There are small decreases again in the three drought categories left on the map for this week. The "no-drought" white area of the map is growing west-east also. It will be interesting to see how much of the drought-afflicted areas shrink as paddling season approaches.
|
03/24/2022 08:34AM |
Here's the explanation for the region from the US Drought Monitor site:
Midwest
Abnormal dryness (D0) and moderate drought (D1) was reduced in coverage across parts of southwestern Iowa and northern Missouri this past week. A storm system that intensified over the Central and Southern Plains March 21-22 brought more than 2 inches of rain to these areas, reducing short-term (30 to 90 day) precipitation deficits. Moderately heavy rainfall also extended into portions of the central Corn Belt. However, despite many locations receiving upwards of 0.5 to 1 inch of above-normal rainfall, long-term drought is firmly entrenched in these areas, leading to a status quo depiction this week. Farther north across parts of northern Wisconsin and northern Michigan, a mix of snowmelt and 7-day precipitation totals led to some removal of D1, as root zone soil moisture and groundwater are beginning to recover, in addition to near and above-normal average stream flows. Conversely, D1 remains in adjacent areas in northwestern and northeastern Wisconsin, extending into the south-central Upper Peninsula of Michigan, where deeper soil moisture and groundwater indicators are recovering more slowly. Elsewhere in the Midwest, conditions are near or wetter than normal, leading to much of the southern Great Lakes and eastern Corn Belt remaining drought-free.
Here's the map:

|
03/24/2022 08:38AM |
Summary
A series of storm systems moved across the lower 48 states this past week. Heavy rain fell across parts of the Great Plains and Southeast, with lighter amounts observed across parts of the Pacific Northwest and Intermountain West. The Central and Southern Plains, Lower Mississippi Valley, and Southeast mostly saw improvements to drought conditions, with several locations receiving more than 2 inches of rainfall (more than 5 inches, locally) during the 7 days leading up to March 22. Throughout much of the U.S., where antecedent dryness coincided with below-normal precipitation, drought either continued or worsened in intensity. The only areas where this was not true was across parts of the Upper Midwest, which experienced some removal of long-term drought due to improvements from melting snow cover.
|
02/04/2022 06:58AM |
US Drought Monitor
At least the dark reds have disappeared from the map. It's still very dry up north and throughout 3/4 of the state of MN. I'm hoping for more snow, at least up in the Arrowhead.
|
12/14/2023 09:17AM |
From the summary of the drought monitor.
"Warmer-than-normal weather covered the region this week; this was most pronounced in Minnesota, where temperatures of at least 9 degrees above normal were widespread. The mostly drier-than-normal and warmer-than-normal weather led to some expansion of moderate, severe, and extreme drought in Missouri and Illinois, where short-term precipitation deficits mounted amid streamflow and soil moisture deficiencies. For similar reasons, moderate and severe drought also expanded in parts of Indiana. Conditions continued to dry in northeast Minnesota and in the Upper Peninsula of Michigan, where abnormal dryness grew in coverage."
Drought monitor
|
12/14/2023 03:11PM |
|
04/01/2022 07:09AM |
|
04/04/2022 09:15AM |

Note the olive color in the MN map as the climate prediction center considers this as "drought removal likely".
|
04/21/2022 07:52AM |
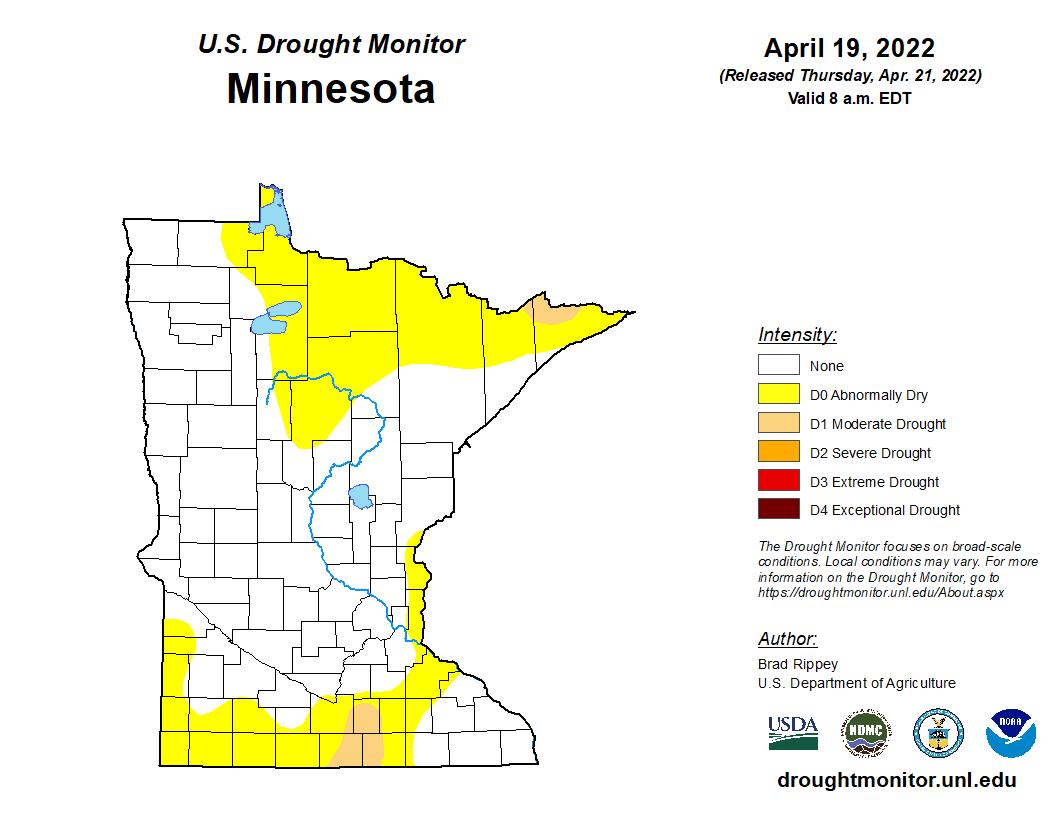
Almost all of the "Moderate Drought" (light brown) has disappeared in the BWCA. There is a stubborn patch of it in hanging on and shrinking in the Sag/Knife area but conditions are improving.
Overall, Abnormal Dryness (yellow) has been shrinking throughout the state, especially in the central, west and northwest regions. However, a dry area has spread in far southern MN. Bad news for our farmers down in that area. Hopefully a few more April showers will continue into May and reverse that trend.
Overall, drought conditions continue to improve across the state.
|
04/21/2022 01:12PM |
Hydrologic Outlook
MNZ010>012-018>021-025-026-033>038-WIZ001>004-006>009-222100-
Hydrologic Outlook
National Weather Service Duluth MN
358 PM CDT Wed Apr 20 2022
...HYDROLOGIC OUTLOOK FOR SNOWMELT AND END OF WEEK RAINFALL...
A multi-day rainfall event this weekend may lead to flooding.
Our Spring 2022 weather conditions have been cooler than normal with above
normal precipitation across northeastern Minnesota and northwestern
Wisconsin. Snowmelt has occurred from south to north in our region leaving
saturated ground where the snowpack has completely melted. A heavy snowpack
remains in the Minnesota Arrowhead and along the International Border
to International Falls. Any rainfall over areas of saturated
ground or heavy snowpack will likely result in efficient runoff leading
to localized flooding.
A strong weather system, expected this Friday and Saturday, will bring
a short period of above normal temperatures to the region. This will
increase the snowmelt rate. Furthermore, heavy rainfall and thunderstorms
are possible with this system which will increase the chances for localized
flooding. Widespread minor flooding is possible due to poor drainage.
Streams and creeks will likely become bankfull and cause minor flooding
as runoff routes to our rivers. River flooding is possible during the
beginning of next week.
The Minnesota Arrowhead has an unusually deep snowpack with high moisture
content. Two feet of snow are common at higher elevation. This snowpack
ranks in the top 10 snowiest winters on record. Areas of the North Shore
in the highest elevation may absorb and store any new rainfall. However,
areas along the slopes of this area will exhibit strong melt in addition
to rainfall. Rapid runoff is possible causing potential flooding impacting
low-lying areas, ditches, culverts in addition to strong river rises.
The Rainy Lake Basin east of Lake of the Woods will likely see localized
flooding due to poor drainage. Strong rises are likely on the Littlefork
River, Big Fork and other drainages flowing north to the Rainy
River.
The Upper Mississippi Headwaters are saw new snow on Wednesday but most
snowpack had melted prior to this event. Again, localized minor flooding
due to poor drainage is likely in the headwaters. Runoff will increase
reservoirs levels throughout the system due to flood control for areas
downstream. Minor river flooding is possible along the Mississippi from
Aitkin to points downstream starting early next week.
The Lake Superior South Shore has snowpack remaining in the Bad River
Basin and the Bayfield Peninsula which could lead to localized flooding
enhanced by runoff and steep terrain.
The evolution of our Spring snowmelt runoff continues and looks to get
very active starting this weekend. If you live by a flood prone area
or immediately adjacent to a river or creek please be aware of water
levels. If you have poor drainage around your home make sure you have
an operating sump pump.
|
03/18/2022 02:22PM |
WhiteWolf: "w_w_w_31: "I am in the West, Grand Junction CO to be exact. It is creepy dry out here. It is the worst drought in 1200 years.
dave
"
Don't know if you mean exactly the Grand Junction area- but Grand Junction area has seen a very wet winter. Wettest DEC on record and top 15 wettest SEP-FEB on record. Maybe you meant a differnt area?? Even so- the West Mtns are no where near "1200" year drought levels. Where they get that from - other than true observational data- is beyond me. True climate observed (records) only go back 120 years or so in the area you describe. 1200 years is a DEEP stretch. Just my .02 as a professional in the weather/climate field for 25 years.
"
The 1200 years is in reference to the multiyear drought the west has been going though since the year 2000. The study come from the journal Nature Climate Change and the study "Rapid intensification of the emerging southwestern North American megadrought in 2020–2021.pdf"
To quote from the article:
" The reconstructed megadroughts and the current event were not exclusively dry across time or space but 2000–2021 was particularly dry in both regards. Of all 22-yr periods since 800ce, only two (1130–1151 and 1276–1297) contained more years with negative soil moisture anomalies than the 18 observed during 2000–2021 (Extended Data Fig. 7a). Subregionally, 2000–2021 drought rankings were generally less severe relative to past megadroughts but 2000–2021 still ranked among the five driest 22-yr periods locally across 61% of SWNA (Fig. 1b). This represents the largest SWNA area to experience a top- five 22-yr drought-severity ranking in at least 1,200 years (Extended Data Fig. 7b).Exceptionally dry soil in 2021 was critical for the current drought to escalate and overtake the 1500s megadrought as the period with the highest 22-yr mean severity (Fig. 2a). The 2021 soil moisture anomaly (–2.58 ?) was nearly as dry as that of 2002 (–2.59 ?), the driest year in the 1901–2021 observational record and notable for its severe impacts on forest ecosystems and wildfire."
In case you are wondering how they calculated a megadrought without records dating back more then 120 years, its from measuring tree rings, a type of record other then pen and paper. To quote again:
" Soil moisture is a particularly important integrator of drought. Soil moisture impacts runoff ratios and therefore streamflow, agricultural productivity and irrigation demand, ecosystem productivity and health, wildfire activity and land–atmosphere feedbacks such as heatwave intensity. Summer soil moisture is particularly crucial, as summer is when water demand from ecosystems, humans and the atmosphere is generally highest, and also the season of focus in most tree-ring reconstructions of drought severity. According to a bucket-type water-balance model forced by monthly climate data, SWNA 0–200 cm soil moisture in summer (June–August) was below average in 18 of the 22 years from 2000–2021 (Extended Data Fig. 5). This turn-of-the-twenty-first-century drought was last investigated by Williams et al.5 through 2018, who speculated that the extended drought event may have been terminating in 2019 due to abundant precipitation that year. Dry conditions returned in 2020 and intensified substantially in 2021, however, indicating that the turn-of-the-twenty-first-century drought is not over."
Here's what NOAA has to say about the multiyear drought, where they make reference to the study: NOAA Research Spotlight Climate Driven Megadrought Quote: "From 2000 to 2021, temperatures in the region were 0.91 degrees Celsius (about 1.64 degrees Fahrenheit) higher than the average from 1950 to 1999."
An observable and immediate measurable indicator of the drought is the California Department of Water Resources Reservoirs Levels Map which shows the historic water level and what the current level is.
|
05/12/2022 08:16AM |
A roughly 2% decrease in the "yellow" (abnormal dryness) affected-areas on the map. The BWCA area impacted by dryness hasn't change though. Maybe some of these latest rounds of rain will make it that far and raise overall moisture levels? However, it's a very positive position statewide, hydrologically-speaking.
|
05/12/2022 08:45AM |
|
06/02/2022 10:06AM |
As the run off continues it will be interesting to see how things fare in mid- July through August. I have to admit, I'm still concerned about a drought returning though I have no scientific evidence to back it up.
|
04/13/2012 12:27PM |
quote tumblehome: "Rain forecast for tonight and snow on Monday. It is dry but not nearly as dry as it could be or has been in years past. Northern MN has been getting rain every few days.
-T"
"northern MN" is a broad area.... where i live in northern MN we have not had rain for a week or more
|
04/15/2012 06:18AM |
here is a link to ia statewide precip for the event
http://radar.weather.gov/radar.php?rid=dmx&product=NTP&overlay=11101111&loop=no
|
04/15/2012 06:36AM |
quote mocha: "it did rain some overnight at my house, not enough to wash any dirt off my truck.
i'd like to see a map that shows rain amounts in various areas of northern MN... it can be raining at my house and sunny 5 miles from here."
Try this. Note you can change the time frame in the lower left corner. Precipitation
|
04/15/2012 06:57AM |
we'd be just as happy with rain, but i guess we'll accept snow.
|
04/15/2012 07:26AM |
North America map
anybody got a better map showing Canada?
|
04/15/2012 07:24AM |
How dry is it?
Ans.: It is so dry that cows are giving powdered milk!
It’s so dry the government has announced a water pistol buy back scheme.
It’s so dry, crooks are siphoning off radiators instead of gas tanks.
It’s so dry, they’re encouraging people to pee in the pool.
It’s so dry, the the dogs are marking their territory with chalk lines.
It’s so dry they’ve had to close two lanes at the swimming pool.
|
04/15/2012 07:03AM |
When the dog runs across the yard and dust flies, it's dry!
|
03/03/2023 06:29AM |
New map

|
02/22/2024 01:30PM |
" A few areas received half an inch of precipitation, but most of the Midwest region saw only a couple tenths of an inch. Dry conditions over the last 1 to 6 months prompted the expansion of D0-D2 in Michigan and Wisconsin and D1 in southeast and northeast Minnesota. The lack of snow (“snow drought”) in Minnesota has had a sizable impact on winter recreation."

|
02/22/2024 02:06PM |
|
02/24/2024 04:12PM |
|
04/06/2023 10:18PM |
|
08/07/2022 10:28AM |
Canada Canada's Current Drought Outlook map
|
08/07/2022 10:04AM |
"More minor rainfall occurred across parts of northeast Minnesota. Otherwise, the region generally saw below-normal rainfall for the week."
"Drought conditions developed or worsened in a few parts of the Upper Midwest that missed out on heavier rains and saw precipitation deficits worsen. This included parts of southern and western Iowa, northern Wisconsin, the Michigan Lower Peninsula, and central Minnesota. In Wisconsin, the Fox River Cruise Company ran into problems docking due to low water levels."
Last Thursdays drought map
|
03/29/2024 09:52AM |

|
08/26/2022 06:32AM |

Link to map.
|
04/10/2024 08:25PM |
OTTAWA, Ontario — Canada's emergency preparedness minister warned Wednesday the country's wildfire season could be more explosive than last year when it led to unprecedented smoke conditions across much of the country and into the United States.
Persistent drought and months of above-average temperatures have raised the risk of a repeat of last year's record-breaking wildfires, prompting federal ministers to wave a red warning flag about the desperate need to address climate change.
''We can expect that the wildfire season will start sooner, end later and potentially be more explosive,'' Emergency Preparedness Minister Harjit Sajjan told a news conference.
The Canadian wildfire season runs from May through October.
The 2023 fire season was Canada's worst on record, burning more than 15 million hectares and forcing more than 230,000 people from their homes.
Smoke from Canadian wildfires poured into the U.S. East Coast and Midwest last June.
|
04/11/2024 07:57AM |

This map looks better than last week's. Some areas have moved completely out of drought which the state hasn't seen in a long time. It's still pretty dry in the Arrowhead, so the BWCA will need a lot more moisture to top off streams and lakes. It's progress. Let's hope for more snow and rain up there.
|
04/11/2024 03:17PM |
|
09/10/2022 10:38AM |
Jeriatric: "Heat this week (106-113F) and dryness have caught us here in Northern CA. Fire started about 6:30 pm Tuesday. Now, it's thousands of acres and the Gov. declared an emergency yesterday. This morning, firefighters are concentrated in my town (Foresthill) trying to prevent the burning of structures. I am under mandatory evacuation in Auburn."
So, so sorry to hear this. I hope your family are safe and your home will make it through. Please keep us posted.
I fear this is another of a long list of "new normals".
|
04/16/2024 02:47PM |
|
09/11/2022 02:05PM |
I feel bad for the areas ravaged by fires....hang in there.
|
09/14/2022 05:54PM |
OneMatch: "Jeriatric: "Heat this week (106-113F) and dryness have caught us here in Northern CA. Fire started about 6:30 pm Tuesday. Now, it's thousands of acres and the Gov. declared an emergency yesterday. This morning, firefighters are concentrated in my town (Foresthill) trying to prevent the burning of structures. I am under mandatory evacuation in Auburn."
So, so sorry to hear this. I hope your family are safe and your home will make it through. Please keep us posted.
I fear this is another of a long list of "new normals"."
The weather has cooled and our house is still intact. We are still under mandatory evacuation orders. I understand that the electricity is off and I fear l’ll be returning to a refrigerator full of waste.
|
10/14/2022 06:58AM |

|
10/06/2022 08:46AM |
|
10/07/2022 05:50PM |
|
01/08/2023 07:24AM |

As of Jan. 5th. Find the original post here.
|
02/18/2023 08:29AM |

Snow depths in the middle of February so far.....

|
03/07/2022 12:35PM |
1200 years? I digress as is not even top 50% in the recorded history. (120-130 years)
My point of this and previous posts is check your data from what the media portrays.
|
10/29/2021 06:22PM |
|
02/26/2022 08:58AM |

I'm not sure if this map will show up in the gif format, but it's from the state Climatology Office/MN DNR. There's some decent snow depth up north. Let's hope for a slow melt this spring.
|
02/26/2022 09:04AM |
|
03/03/2022 10:08AM |
OneMatch: "
Dang, it's so hard to believe that the arrowhead region is still moderate to severe considering all the snow I've heard has fallen up there."
To quote my post from 11/19/21.
"Once things get locked up by the freeze they do not change much during the winter in Minnesota."
|
03/03/2022 10:21AM |
There’s not just one type of drought. The three key types are:
Meteorological: less precipitation than normal
Hydrological: how lack of precipitation affects streams, lakes, snowpack, and groundwater
Agricultural: how lack of precipitation impacts crops and livestock"
The making of a drought map from above
|
03/03/2022 10:15AM |
|
03/03/2022 12:34PM |
|
03/03/2022 12:36PM |
|
03/17/2022 09:43PM |
|
03/07/2022 11:39AM |
dave