|
04/21/2021 01:50PM |
|
04/22/2021 06:42AM |
bwcadan: "I have often wondered if a major drop in temps of over 30 degrees as we had over a month ago in St. Louis would reduce the average temp for the date and then be reported as a new lower average next year for that date. I think I now have my answer in the new data generated and tabulated each decade. Should we have such a cold snap each year on the same date, it would be reported that "normal"/average temps would show a decrease from say the previous date before climbing upward again. These events would be quite rare I would think. Do you know of any?"
Very good question.
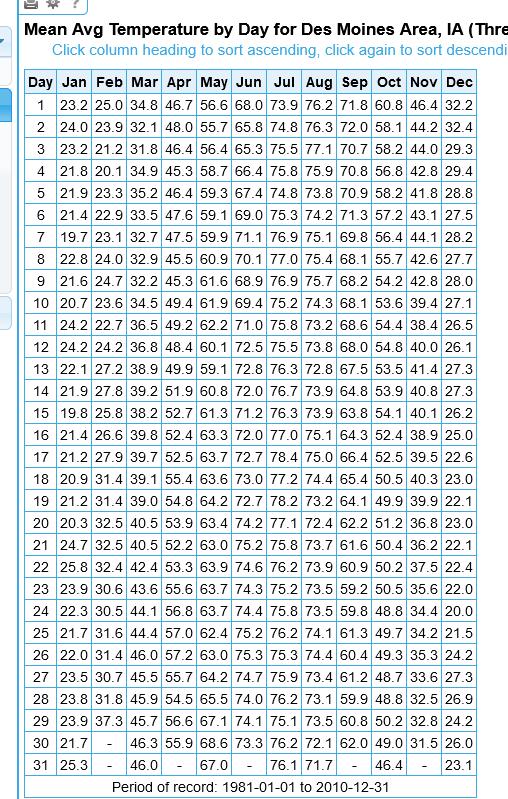
Happens all the time when you look at the actual raw data before it gets rounded and adjusted slightly to make it appear what most think, smooth curve- Especially since you only have 30 dates to avg- for say April 22nd- 10 from the each of the 3 decades being used- even a person not versed well in math is going to understand no way will it be a linear with a smooth curve all the time throughout the year in dealing with weather. It's very difficult to find something that is not like this on the internet -- a smooth curve that most think is the case for avg temps throughout a year- (at least for the Midwest area of the USA) a rise up in avg temps in the later Winter/Spring / early Summer and than a fall starting late Summer into mid-Winter.

However- when you've been around as long as I have- you have your ways. The following chart lists the same as the above - but in raw format before adjusting. You clearly can see the avg temps jump around quite significantly even in short time span- April 18th and Feb 4th, DEC 27th, and of course leap years- FEb29th really stand out showing it's not a linear curve as most think. BWCADAN will really like this--- (I can do the same for St Louis if you want or any location's RAW #'s)
|
04/19/2021 06:01AM |
--- If I had time more to publish old weather records/ to rather new ----- - within the 30 year term- and adding 10 and subtracting 10- I would get into the why's or whats--


|
04/19/2021 10:43AM |